
Friday, March 25, 2011
Thursday, March 24, 2011


Wednesday, March 23, 2011
Some Poker v Trading links for @traderette on twitter
Howard Lederer: On Poker & Trading the Markets http://www.youtube.com/watch?v=qcPD9AmVdl0
Very long detailed article http://www.chrisperruna.com/2010/07/13/trading-and-poker/
Bunch of stuff that says much the same thing...Applying Poker Strategies to Trading The Markets http://www.traderslaboratory.com/forums/f43/applying-poker-strategies-trading-markets-631.html
Ten Lessons I Have Learned About Trading From Poker http://www.traineetrader.com/ten-lessons-i-have-learned-about-trading-from-poker/
Learn Stock Trading From Actively Playing Poker http://www.thebestonlinetrading.info/2011/03/learn-stock-trading-from-actively-playing-poker-2/
Tuesday, March 22, 2011


AUDUSD Initial reaction to that 1.618 Extension was purty good...

AUDUSD Hrly

Sunday, March 20, 2011


Saturday, March 19, 2011
view of 2/3rds of hardware hacking room
a bit of a mess at the mo, but here's the reason that I can repair stuff, the main room in my house is devoted to pulling apart sick machines n piecing together well ones... I am strictly an amatuer at this stuff.
 ratio of recovery is generally about three dead machines = one good machine... stacked to the gills.

additional twitter/blogging oriented Station
Thanks to an unexpected find, a 22" monitor for $10.00 at a garage sale, and a thrown out laptop from a while ago, since repaired, I have now got a "side station" to my main trading desk... been kinda planning this for a while since hitting twitter, wanted to keep the two screens on the main station free... so v pleased this has coe together this weekend.


that's the new "twitter n blogging station...
N this is the complete shebang.. still some rough edges n crap wiring to sort, but function is now there


Friday, March 18, 2011

Thursday, March 17, 2011
Quick squizz ar EURUSD

;)
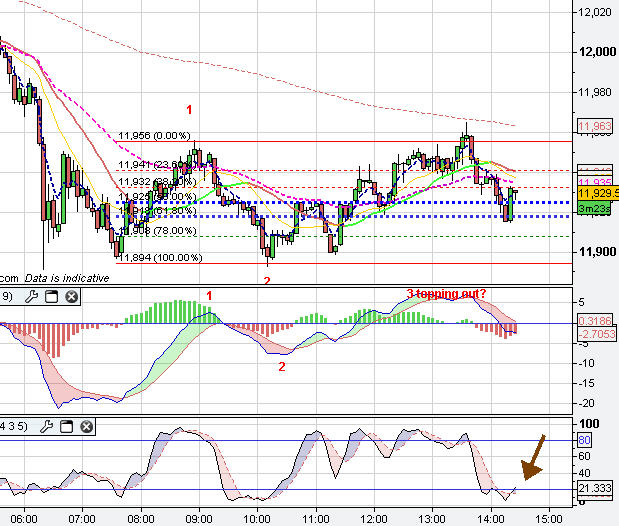
Quick n dirty Hrly Spi analysis

Check the stochastics... a drop past oversold would not surprise with that pattern either.
Ultimately I reckon that price has every chance to get up to within the two dotted horizontal blue lines, the 50% and 61% Retrace of the entire drop. If price gets there and how price gets there remains in the hands of the market gods.
;)
Wednesday, March 16, 2011

Tuesday, March 15, 2011


Monday, March 14, 2011

Sunday, March 13, 2011


TadewiJedT rehash
DAX has met some short targets. into fri's 5ddlows & bottom of channel 1. think it will test underside of previous support .around the 7150ish level. SPX made a move on the projected 1313 level already. see the possibility of a nice island reversal on DAX FTSE met the projected 5800, bottom of channel , fri's 5ddlows & looks like ST bottom - maybe test 5900ish? 7150/5900/1313 are the new d-weekly 50% on DAX/FTSE/SPX, respectively. so maybe a good area to reverse - see how it travels. the other thing is there is a fair amount of fear amongst the herd which gives me incentive to look the other way but not entirely. if price goes the other way then i will reorient to those lower brown bear targets - DAX bottom channel 2, 5ddlows & d-weekly/lows around 5900 or 200ma around 5800

Saturday, March 12, 2011
Some days (or nights) are diamonds
Yup I am boasting... you have a prob with that, unfollow me.
Last night was a goody for me, note this was purely scalping play based on wave and momentum reads on 5 min charts... pre market prep, ignoring the doubters, and doing my own thing.
Now if'n ya wanna "dog" these trades, n tell me how they could have been better... show me some live calls like I do and i'll listen otherwise STFU and bow the F down.
GBPUSD
winkinatchaAUS Mar 11, 6:59pm via HootSuite

AUDUSD
winkinatchaAUS Mar 11, 9:18pm via HootSuite
 winkinatchaAUS Mar 11, 9:16pm via HootSuite Indices are illing still, but I am very mindful of the spi Discount on cash close tonight, and am looking for legit ways to go long..
winkinatchaAUS Mar 11, 9:17pm via HootSuite
winkinatchaAUS Mar 11, 11:13pm via HootSuite

Last night was a goody for me, note this was purely scalping play based on wave and momentum reads on 5 min charts... pre market prep, ignoring the doubters, and doing my own thing.
Now if'n ya wanna "dog" these trades, n tell me how they could have been better... show me some live calls like I do and i'll listen otherwise STFU and bow the F down.
GBPUSD
winkinatchaAUS Mar 11, 6:59pm via HootSuite

AUDUSD
winkinatchaAUS Mar 11, 9:18pm via HootSuite

winkinatchaAUS Mar 11, 9:17pm via HootSuite
winkinatchaAUS Mar 11, 11:13pm via HootSuite

Friday, March 11, 2011


Looking to add to AUDUSD longs

price is a pit powerful at the mo tho and since captruing this chart we have bounced from the displayed levels and are retesting wave 3...
darnit
AUDUSD 5 min chart long
Here's my take on current long on AUDUSD
IF price can get above the local high of the first wave up marked 1 on MACD mavs..

IF price can get above the local high of the first wave up marked 1 on MACD mavs..

DOW JONES on IGMArkets

Currently we have 5 discernible tho conjectured waves down, a legitimate time for a bounce if only 50 % of last down leg.
Daily chart shows the current action a little clearer as a 3 wave..

Fib extensions based on first wave down gives a legitmate bounce point if further downside ensues, which would be 'round where I 'd be looking for termination of a wave three, then a wave 4 up, then a 5 getting down possibly to the marked lower trend line
Note I am saying that current action is quite possibly an ABC style correction after a marked 5 wave trend up from July 2010 lows..
Wednesday, March 9, 2011


Tuesday, March 8, 2011

Potential downside targets on EURUSD hrly

Used as an equal measure move from recent higher low goves nice confluence with trendline (taken from zoom out). giving a bounce point at around 1.39
Also coincides with a 1.618 fib extension of first down wave
used as calc for eahd and shoulders gives a lower targed around 1.387 also coincides with 200 period moving average on this timespan.
Not I am longer term long oriented on this pair tho may be wrong.
Quick zoom out to show trendline...

Monday, March 7, 2011
"nicer" long analysis for usdCad

Sunday, March 6, 2011


Subscribe to:
Comments (Atom)