
Sunday, July 31, 2011
These trendlines are the business
as in the following v recent chart, drawing a trendline at highs and checking to see what a price retrace does on Impact can help sticking to a trend.

Wednesday, July 27, 2011
On the Converse... USDCHF Daily
following the theme from last two posts in regard to EURUSD suggesting Possibility of lower timefram trend reversal (suggesting potential $USD strength) the USDCHF is at an interesting level in a long term down channel that has been signigicant for 7 months.


EURUSD Daily... Just how much of a reversal on lower timespans can we expect???

Tho in relation to previous post... the above chart is the DAILY... check the Black trend line break.... the potential that just a minor test of that break (downside) before a resumption of a DAILY uptrend cannot be dismissed.
EURUSD HRLY MACD n fibb extensions suggest HRLY based uptrend complete.
Tho Nowt is certain the Winkinatcha esoteric combination of FIbb extensions, wave counts n MACD divergence is suggesting that this pair has completed it's current uptrend.
the following hrly chart touches on a couple of these factors, n the little black box at the top represents the target area for the completion of the (current) uptrend on this timespan...
Not location of box indicates QUITE STRONGLY that when it comes to time factors, I have NO CLUE :P

the following hrly chart touches on a couple of these factors, n the little black box at the top represents the target area for the completion of the (current) uptrend on this timespan...
Not location of box indicates QUITE STRONGLY that when it comes to time factors, I have NO CLUE :P

Wednesday, July 20, 2011

Thursday, July 7, 2011
Spi Daily conjecture
To add to the twitter mix of charts on spi potential, looking at the upside pic on the daily...
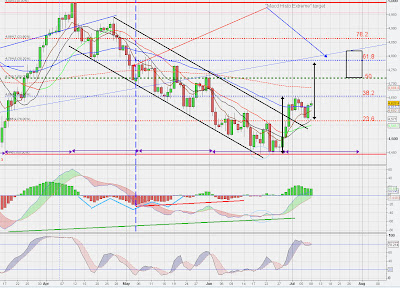 Note Fibonacci retracements marked in red on RHS of chart for levels.
Blackbox on right includes a cluster of potential upside targets.
- equal measure move as marked by black double headed vertical arrows
- 50 - 61.8% fib retrace of drop
- 1.618 fib extension (not marked) of first leg up (left most doubleheaded black arrow)
Histogram Extreme (esoteric winkinatcha stuff) level from macd histograms printed during decline.
"seems to fit" cycle/time as marked by horizontal purple arrows, the time of the initial expansive move up March to April.
Wednesday, July 6, 2011
EURUSD 4HR Potential MACD supported wave count
Just a heads up that may not mean a thing...
Since my last post, where I went into some detail on the bigger picture EURUSD, I have been privately following this pair as its little story plays out.
It's done good, bouncing from the area of the bottom of the Price trap that appearred on the daily chart, and now with price in an interesting position after a fake breakout to the upside of the same price trap.
Here's the daily chart updated from last post:
 Last post price was coming in to the area as marked by the red arrow at the bottom of teh price trap dilieated by dark blue lines. Gave a good ride up to the top of the trap with a minor break but no follow through.
Note Price is currently pretty much conforming to the marked light blue Down Channel, which could suggest that the old marked C??? is a valid potential downside target.
HOWEVER...
In watching price to see how it behaves on lower timespans as it approched the proposed significant levels of the marked price trap, I have noticed that the 4 Hourly is in an interesting position at the moment and there are SOME hints using my esoteric wave counting stuff, that this pair MAY be about to try for some more significant upside.
4 Hourly Chart:
 With the daily price trap levels marked in red here, on this timespan, from the first bounce off the lower trap level, Price COULD be forming a nice clean 5 wave up trend. currently in wave 4 down, with the potential that this wave MAY be about to bottom out before embarking on wave 5 up.
Note that this is an example where "my" macd based wave counts diverge markedly from strict Elliot Wave (EW) as current price levels would mean that we are impacting on wave 2 in a significant way which is not allowed as a legit wave 4 in EW.
But it is allowed with "my" stuff so meh :)
Anyways, popping down to the lower timespan of the hourly and there are a few hints that upside maybe valid there as well.
Hrly chart:
 Not enough to necessarily bet the farm on, but price since rejecting levels at the 4hrly marked 3 count has retraced between 50 and 61,8% of the marked 2 level to 3 level, a very sweet area to start a campaign to get wave 5 under way... definately some slowdown or congestion over the last few hours at this level, and even POSSIBLY a double bottom type of arrangement within the marked ellipse, double bottoms oft being a termination pattern for wave 4s.
So... personally I am testing the longside here, with a nice tight stop thanks to current location of price...
And upside could be worth checking over the next day or two, as a wave 5 would mean the likelihood that price is gonna make an attempt to break the trap to the upside again.
we'll see and a bit of fun with the esoteric wink stuff.
Safe trading all y'all
;)
Since my last post, where I went into some detail on the bigger picture EURUSD, I have been privately following this pair as its little story plays out.
It's done good, bouncing from the area of the bottom of the Price trap that appearred on the daily chart, and now with price in an interesting position after a fake breakout to the upside of the same price trap.
Here's the daily chart updated from last post:

Note Price is currently pretty much conforming to the marked light blue Down Channel, which could suggest that the old marked C??? is a valid potential downside target.
HOWEVER...
In watching price to see how it behaves on lower timespans as it approched the proposed significant levels of the marked price trap, I have noticed that the 4 Hourly is in an interesting position at the moment and there are SOME hints using my esoteric wave counting stuff, that this pair MAY be about to try for some more significant upside.
4 Hourly Chart:

Note that this is an example where "my" macd based wave counts diverge markedly from strict Elliot Wave (EW) as current price levels would mean that we are impacting on wave 2 in a significant way which is not allowed as a legit wave 4 in EW.
But it is allowed with "my" stuff so meh :)
Anyways, popping down to the lower timespan of the hourly and there are a few hints that upside maybe valid there as well.
Hrly chart:

So... personally I am testing the longside here, with a nice tight stop thanks to current location of price...
And upside could be worth checking over the next day or two, as a wave 5 would mean the likelihood that price is gonna make an attempt to break the trap to the upside again.
we'll see and a bit of fun with the esoteric wink stuff.
Safe trading all y'all
;)
Subscribe to:
Comments (Atom)