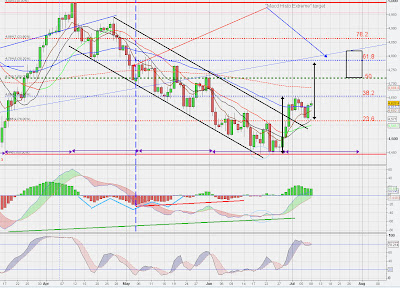
To add to the twitter mix of charts on spi potential, looking at the upside pic on the daily...
Note Fibonacci retracements marked in red on RHS of chart for levels.
Blackbox on right includes a cluster of potential upside targets.
- equal measure move as marked by black double headed vertical arrows
- 50 - 61.8% fib retrace of drop
- 1.618 fib extension (not marked) of first leg up (left most doubleheaded black arrow)
Histogram Extreme (esoteric winkinatcha stuff) level from macd histograms printed during decline.
"seems to fit" cycle/time as marked by horizontal purple arrows, the time of the initial expansive move up March to April.

No comments:
Post a Comment