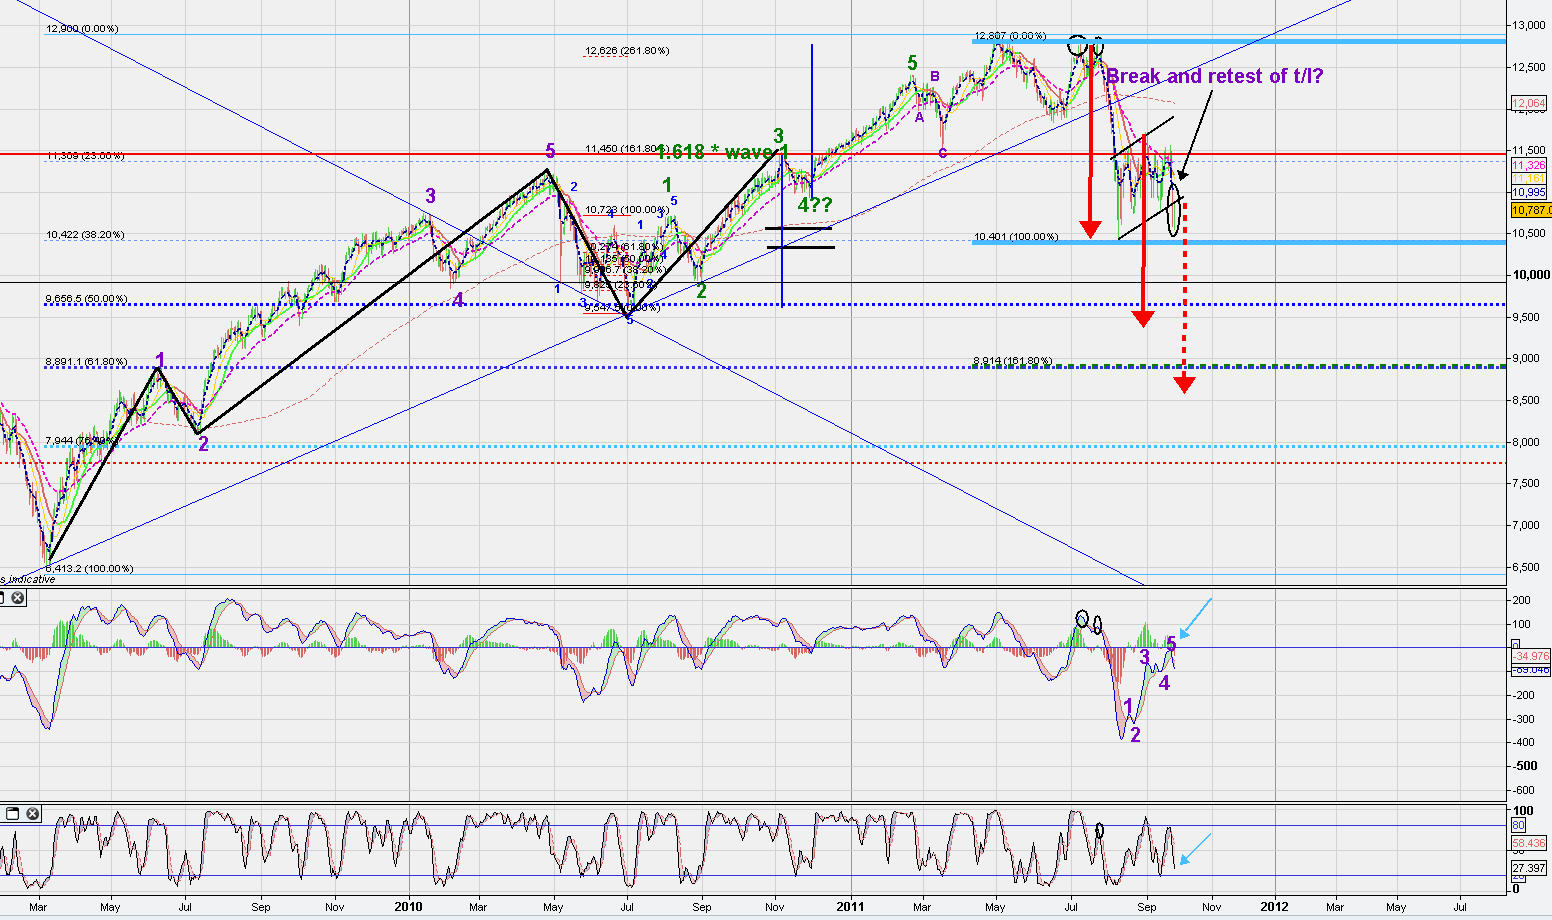
Friday, September 23, 2011

Simple Uber Bearish View of DowJones

(Note IGMarkets chart so price levels may vary from underlying)

Daily
Looking at the last three months daily Price action as  a Bearish Pennant formation, a simple uber bearish view.

Not absolutely sure if the "Pole" for the pennant is supposed to be added to the "top" of the pennant or the "bottom" so dotted red arrow shows the "worst Case" scenariom, and filled Arrow shows the lesser worst case.

Note the level confluence between the dotted arrow and the Green dotted (lowest) 1.618 Fib extension of the first wave down.

As marked on the Pennant Break, price has broken and retested the bottom trendline in the last two days action... the Bearish perspective on that is ... downside is very available now.
also on the bearish side, the marked wave counts on the MACD, three discernible waves up and a Failure to break the zero line is a precominantly bearish sign.

Bigger picture view:

the dotted thick dark blue lines represent 50% (near solid second red Arrow head) and 61.8% (near 1.618 extension mentioned above and dotted red arrow head)

Simle bearish View n a few things to suggest it might be true...
;)

Interestingly Similar Patterns

I noticed this similar pattern on two of the instruments I have been analysing n trading recently :


Instrument 1

Instrument 2


Exerpted from different areas in the big picture...


Instrument 1 = Gold Daily
Instrument 2 = Spi 3 Daily

Don't necessary mean a thing but sure would be neat if gold followed what SPI did :)


Saturday, September 17, 2011

Gold update

Current Hrly chart:
This chart shows gold's decline frrm the high of 6th of September thru to markets close this week.

Rude as it is, I actually went long gold Friday... a few reasons are in the chart.
Reason 1
The marked Fibonnacci retracement combo is based on the first decline from the high, to the first bottom.

During gold price's subsequant travels, the first retrace terminated between teh 61.8 and the 76.4 fib levels.

Fib retraces and subsequant extensions seem to work based on the higher the retrace the lesser the extension.

An extension of 123% of the first leg is shown by the thick dotted light blue line.

This level also coincides with the bottom of the interim channel with the black 5 wave count on price.

Also Very close to the level as marked by the Equal measure move speculation of the Thick red Arrows

So a good target level, and of interest as a potential bounce point

Finally an esoteric Wink MACD MAvs signal showd the long signal occurring as marked by the small green arrow. A plough through significant resistance of the first wave's low and a ride back up to the top of the black channel...

Now Fundamentallybased pureluy on COMEX margin Hikes, I can see more downside as a possibility and significant lower historical gaps (not shown on this chart) also have an attraction about em.

In the meantime thoughthe price action in this most recent decline (marked wave count on price) shows a corrective and (relatively) shallow decline. I am open to further upside at this stage, Possibly only to the top of the lime green marked channel, but Technically I beleive as high as 1860 (on this chart) is valid first.

Esoteric MACD Shizzle...

The manner in which the MACD MAVs have just crossed and bracketed a histogram bar, with the subsequant barr being less suggests to me that this is not a sustainable, new High up move.


There is a similar example of this phenomenon on the First up move in the current chanell..

And the middle up move as well... not shown here... Esoteric stuff, not so easily tradeable.

Future direction, based on this timespan?  Guesses guesses guesses. I have closed my long on the black channel hit, I am looking to see what price does around this level with the potential of stall/failure at the limegreen larger channel top, I will wait.

The 4 hr shows some interesting stuff... Firstup Big picture view of the latest uptrend...

FROM an MA on price perspective, Price is riding the declining 41 MA, 21 ma cluster. (pink dotted n currently red solid MAs).

Something of interest to people who may beleive that a MACD moving Average crossover denotes uptrend.. there are two thin vertical lines on the price chart, which coincide with MACD Mav crossovers and Lo n behold, the leftmost was a near high, and the rightmost was a high... this xover thang is NOT (by itself) a signal for commencing an uptrend..s these two examples clearly show, you need the right crossover.

Also of interest, the most recent trendlines on the stochastic.. and the ellipsed bottoming and topping patterns... This latest UP break could well suggest the stochs on this timespan need to get themselves back up to oversold...

In summation...
The recent decline form the top marked as 5 has satisfied (albeit in a smaller timespan) the requirements for a three wave correction after a 5 wave Advance.

the second leg of this declining correction has been more corrective than impulsive and has me hesitant to suggest that further fulls in the NEAR future are likely.

Price is approaching channel tops on the 4 hrly and 1 hrly.. should price break through this channel resistance we may see the start of another impulsive wave up, BUT I will be observing indicator signals in these areas and trendlines on lower timespans in case this is gold's means of shaking off traders before a mre serious decline.

As stated at the top of this post, from a fundamental and Gap perspective i beleive we have significan downside yet to occur... interim Price action is suggesting this downside may be a while off.

Monday, September 12, 2011

SPI Update

Right... last post on SPI Done during market close on the weekend, I was conjecturing UP... At the time I was wrong as we had down for a further day, Up did not come till AUS overnight last night (US Open Session).

A big swathe of my "broader" analysis is based on shizzle I've developed "on my own" over the last 3 years... a combination of MACD and price wave theory.

I feel like a bit of a lone voice in the wilderness with this methodology (Sniff... so Alone) but in my travels through the interwebs, I have come across the odd article or post which touches on the same... I also remember reading Alexander Elder's (or is it the other way around Elder Alexander... apologies if so) book "Come into my trading room" which touches on similar, and Bill Williamson's "trading Chaos" which also touches on similar in greater detail...  neverthe less a big portion of what I use I've "developed" in relative isolation from other practitioners of this method, if they exist.

In doing so I am constantly learning n refining stuff about it.

One great insight that I am trying to convert into good trading money is finding the appropriate timespan to find "clean" wave counts n correlation between Price and the MACD Moving Averages (MAVs).

the action on the spi and my weekend conjecture based on lowish timespans is a classic "incorrect" timespan gaffe.

My conjecture was based primarily on the 15 minute chart... vis:

twas a reasonable enough conjecture with conts all apparently neato n stuff, but ultimatel Not quite on the ball, as the action for the day saw a significant new low occur 80 odd points below that shown on this (old) chart...


I got the HALFWAY mark of the drop on sunday.. LOL!

but anyways the point I wish to make, going back to the timespans thing, is that there was a far bhetter timespan to be looking at, namely the 30 minute....


Much Neater Eh?

;)

Gold Update

Gold update...
m'kay First up the hourly:

First up... that Blue Dotted Arrow...

At the time that price was moving in that area I made a comment on twitter that Gold is Acting like it is in a down trend. 
Sure enough, price over time confirmed that at least in this timespan it was not just an act, but the statement "acting like it is in a downtrend" prolly needs to be quantified a little...

In a downtrend, price tends to reject levels of resistance, in an uptrend price tends to ignore levels of resistance or punch through.

the trendline resistance was touched as per the wick highlighted by the blue dotted arrow, but there was no follow through, even though price had made a couple of attempts at that area in prvios bars. That shizzle DOES NOT happen in an uptrend... and when that shizzle DOES happen.. by golly it's significant and worth noting.

Be that as it may, looking at the light blue arrows, the levels reached over night (Aussie night that is... US day session for the rest of the world) are fairly significant, price is back down at the 50% level of the previous ( rise that terminated a week ago... plentuy of reasons for a bounce here.

The almost flat latest trendline is the most obvious next bit of resistance for gold to dandle with we'll see how and if it reacts there.

IF the marked red MACD wave count is correct, then a wave 3 bottom is still to come... and if said wave 3 bottom DOES come, then:

A: it should be Lower on Price than Wave 1
B: The MACD Mav's should make a lower bottom than the marked wave 1 on them

I would also EXPECT that this bottom on the MACD Mavs will have a higher low on the MAVS with a lower low on price before entering a conjectured wave 4 up.

I have no position at the moment.

The next post, due in about 15 mins or so will take a bit of a look at timespans (relating to the SPI, a different instrument altogether) and how there will be a "correct" timespan for the  MACD v Price wave counts... Why the heck am I saying this? well tis not impossible the hrly is not the "Correct" timespan for clean counts with Gold... we'll see... looks like it is doin fine so far.

;)

Sunday, September 11, 2011

Some thoughts on the SPI

Right... first up, My "Tape Read" from Friday suggested that monday would see either an open Greater than cash close, OR (recent addition) price reaching the Cash Close SPI value From Friday, sometime during the Monday Day.

Using IGMarket's Aussie 200 Data, ( THIS WILL DIFFER FROM ACTUAL SPI FIGURES but the movements in price remain similar) Cash Close Friday was at 4183... Market close at End of the US Session was at 4100... The potential for an 80+ upday seems a bit unlikely to me at this stage.. If It Occurs, I will be truly gobsmacked.

In the meantime... A quick look at the 15 min chart from a BULLISH (short term) perspective...

This chart is just looking at the downtrend from mid week.  MACD Moving Averages are not giving me a good clean wave count to be reflected on price at the moment, so price wavs are a bit of a massive conjecture... the greatest support for such things tho, is that a 1.618 extension of marked wave 1 down gives the dotted Green line and a reasonable area for completion of wave 3... I note that  the last little bit of price actionals has given a higher low divergence on the MACD Moving Averages versus thelower low on price... Oft a start of either a wave 4 or wave 1 based on this methodology.... coupled with a break of the (red) 21 ma (yet to be seen if price holds above) and previous tests during the marked wave 3 down of 21 and 41 MAs, this rapid decline HAS satisfied a few requirements along its impulsive decline.

"Tape Read" from US Close suggests SHORT for 8+ points from SPI open... these are short term trades (within the first 20 minutes) and do not give indications for an expected trend for the rest of the day...

From a cynical perspective, 'twould not surprise me to see panic selling on Cash open from those that were long over the weekend, and equally it would not surprise me if the smart money/big boys/Floor trader equivalents were to push price up post the panic selling to rip the hearts out of the non-proffessionals who sold on open, and perhaps suck them into to buying once more...

We shall see eh? :)

Saturday, September 10, 2011

Tech and Ramble on gold

'Kay, for this weekend's Gold Analysis I am going to start off with a 3 hour chart... not cos there is anything magical about the number but because I have been using the 4 hour and lower as working charts and they are full of lines and squiggles, the majority I want left there. By switching to 3, my charting package gives me a clean slate,  so I can simplify the view.

3 Hrly
Applying the MACD waves versus price waves, the uptrend from late June, has conformed almost picture perfect and THEORETICALLY has satisfied 5 waves up as marked.

(Wave counts for uptrend In Purple)

Various wave theories suggest 5 waves up are followed by a retrace of minimum 3 waves... EW uses the ABC markings for the retrace and I've emplyed that methodology hare as CONJECTURE that we are entering into a retrace scenario. BUT note as marked by the most recent Green Arrows on lows and highs, in terms of a definition of a down trend, (Lower Highs, Lower lows) we are but POTENTIALLY halfway through fulfilling this definition, One measly lower High marked at the "b" level, so as much as i want to say "Short Gold forever" a bit of caution is probably worthwhile. (I'm still sticking to the short side though :) )

Of INTENSE interest to me is a bit of fundamental news regarding gold... COMEX (supposedly the largest Gold Trading Exchange) has raised Margin Requirements again... from 27% to 40% I gather, effective starting Monday US time.

When was the last time they raised margin requirements? 23rd of August... What happened then? a 10% decline in price over three days... With the new increase, I do wonder what effect that might have. One recent historical event and the result do not a precedent make, but that is well worth thinking about.

In the meantime though, one can see that Gold has some pretty neat resistance and Support via some triangulating trendlines. The downside sets up some nice scenarios, (Height of mouth of triangle being the expected measure of breakout to downside or upside == length of a = length of c)

Switching to the 4hrly working chart...Just showing the last few weeks

Here I've marked out the conljectured c wave.

Note the most recent black trendline shows a break and retest...

Not much more I can say here MACDs are BARELY hinting at a down trend (MAVs below zero line) Stochastic in no mans land.

Green dotted line shows a 1.618 EXTENSION odf marked wave A... don't mena much but if this is to be the start of a serious downtrend then such would be a good target IF we are about to enter or have entered a third wave down.  All in all though here we have a "coin toss" situation technically.


A quick look at the hourly, of particular note the marked Red Counts on MACD and Price...

Still a bit of a no mans land according to the MACD and its current like for the zero line.. Stochs suggesting downside... and a lot of indicision.

An interesting week next week no doubt.
 

;)