
Wednesday, August 31, 2011
Gold scalp on 5 min... looking for more down, but easing in to market
Tuesday, August 30, 2011
Some s_t gold observations
The following Hourly chart is my working chart, and so it is getting a little busy for easy public dissemination. reference back to my twitter blog for as it happened info.
 The Adam n Eve formation played out pretty well, and in doing so, a conjectured 50% Retrace of an observed "elongated S" pretty much happened. the red dashed line is the 50% retrace level of that pattern, missed by 5 Gold dollars.
The Black lined channel stood out significantly and gave me the opportunity for a low risk short when price came back to hit the upside... Full advantage of that low risk was taken on that significant break through the top of the conjectured channel, and said short was exited with a small loss.
the old gray matter was not nimble enough to switch to longs so the rest of gold's (Aussie overnight) actionwas left alone. This morning I've had a closer look at the Momentum waves via the MACD as well as price and I See the following.
Currrently price is up at a localised (in the current hrly uptrend) double top level. Marked momentum waves COULD be hinting at a completion of 5 waves upwards (but need the MACD lines to cross over to confirm completion), supported by the stochastics on this time span being back in the Overbought region, again a crossover of THAT indicator required before too much excitement about downside can occur.
ASSUMING that the MACD waves are reflected in price, then a reasonable upside target is the dark green dotted line, a 1.618 extension of the Price level at the top of the momentum wave 1...
All in all though, I am disinclined to take a position either long or short with price at current level...Looking at an even lower timespan of 30 minutes...
 Price patterns suggest a toin coss level at the moment, though note the INDICATORS arew suggesting reversal.
As said, not touching this instrument right now... I will let price decide what it wants to do and attempt to ride it when it makes up its mind.

The Black lined channel stood out significantly and gave me the opportunity for a low risk short when price came back to hit the upside... Full advantage of that low risk was taken on that significant break through the top of the conjectured channel, and said short was exited with a small loss.
the old gray matter was not nimble enough to switch to longs so the rest of gold's (Aussie overnight) actionwas left alone. This morning I've had a closer look at the Momentum waves via the MACD as well as price and I See the following.
Currrently price is up at a localised (in the current hrly uptrend) double top level. Marked momentum waves COULD be hinting at a completion of 5 waves upwards (but need the MACD lines to cross over to confirm completion), supported by the stochastics on this time span being back in the Overbought region, again a crossover of THAT indicator required before too much excitement about downside can occur.
ASSUMING that the MACD waves are reflected in price, then a reasonable upside target is the dark green dotted line, a 1.618 extension of the Price level at the top of the momentum wave 1...
All in all though, I am disinclined to take a position either long or short with price at current level...Looking at an even lower timespan of 30 minutes...

As said, not touching this instrument right now... I will let price decide what it wants to do and attempt to ride it when it makes up its mind.
Monday, August 29, 2011
Gold Hourly Followup
Action from the US Session Pretty much followed through from the pre-session analysis...
Hrly Chart:
 Tough as it was to do, an Add to the short position on a break of the green trendline came god, with partial profits taken at level of head of second down arrow.
The Red dashed line is 50 percent of the perceived elongated s pattern depicted here (blue segments), and is the "ideal" conservative target based on historical observation of this pattern.
SHOULD price hit that level, there is a high possibility of a good bounce... or... smash through the congestion and make new lows.
Short term price action is suggesting Bounce more likely, with the potential for new highs to come.
Hrly Chart:

The Red dashed line is 50 percent of the perceived elongated s pattern depicted here (blue segments), and is the "ideal" conservative target based on historical observation of this pattern.
SHOULD price hit that level, there is a high possibility of a good bounce... or... smash through the congestion and make new lows.
Short term price action is suggesting Bounce more likely, with the potential for new highs to come.
Gold Hrly n 30 min
Gold is being a masive pain to trade right at this moment, with a tight range n no doubt low volume possibly exacerbated while London enjoys a Bank Holiday.
Hrly Chart
 Overall I am short oriented on the slightly longer term, seeing the action of the down move 23-25th Aug, as being as yet an incomplete downtrend.
This chart Appears to me to be showing one of them "elongated S" things and current Action COULD be an adam n Eve top on the shown chart, but until that green upsloping trendline breaks, well I Just don't know... Particularly as one can see a buy signal via the MACD moving averages as marked by ellipses n green arrows on Price and the MACD.
If I had my choices, I would also like to see an opposite such signal now... meaning a higher high on price and a lower high on the MACD Mavs.. not there yet.
Arr n just to highlight the "elongated S" thing, (reference from long winded blog), here's the 30 min with it mapped out (badly) using light blue line segments.
 The minimum target for shorts here is the congestion around mid point of this pattern round the 1780 price level on this chart...
In the meantime, small possi still open short, most closed due to lack of patience on my part, perhaps a further opportunity to add may arise...
Resulting Price action Shown Here...
Hrly Chart

This chart Appears to me to be showing one of them "elongated S" things and current Action COULD be an adam n Eve top on the shown chart, but until that green upsloping trendline breaks, well I Just don't know... Particularly as one can see a buy signal via the MACD moving averages as marked by ellipses n green arrows on Price and the MACD.
If I had my choices, I would also like to see an opposite such signal now... meaning a higher high on price and a lower high on the MACD Mavs.. not there yet.
Arr n just to highlight the "elongated S" thing, (reference from long winded blog), here's the 30 min with it mapped out (badly) using light blue line segments.

In the meantime, small possi still open short, most closed due to lack of patience on my part, perhaps a further opportunity to add may arise...
Resulting Price action Shown Here...
Saturday, August 27, 2011


Friday, August 26, 2011


Thursday, August 25, 2011

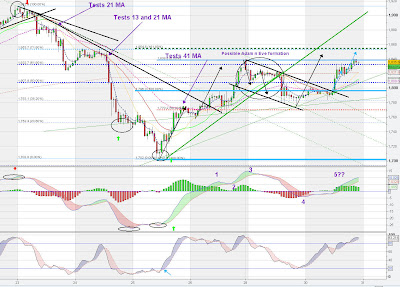
Gold 4hr n 1 hr working charts
hrly
 I only see 3 waves Down on this hourly.
Personally I reckon we have another to go on this timespan, but in the meantime the Hrly Buy signal as marked can not be ignored...
i haven't looked much at the lower timespans but I do note, A quick glance at the structure of the latest upsurge on the hrly seems to suggest it has an internal 5 wave structure, so... AND is interacting with the 41 MA at this time... This suggests to me that there is a high possibility price may test the now broken 21 MA (Green/Red) in a corrective 3 wave down fashion... If so how price acts $24 below current will be interesting.
4 Hrly
 Stochs are kicking up on this timespan, Again I'm only seeng 2 waves down here n looking for a 3rd with some interaction of Price in the marked "buy zone"
Note that the sell zone was overshot, so may hap the buy will be undershot... Dunno.

Personally I reckon we have another to go on this timespan, but in the meantime the Hrly Buy signal as marked can not be ignored...
i haven't looked much at the lower timespans but I do note, A quick glance at the structure of the latest upsurge on the hrly seems to suggest it has an internal 5 wave structure, so... AND is interacting with the 41 MA at this time... This suggests to me that there is a high possibility price may test the now broken 21 MA (Green/Red) in a corrective 3 wave down fashion... If so how price acts $24 below current will be interesting.
4 Hrly

Note that the sell zone was overshot, so may hap the buy will be undershot... Dunno.
Tuesday, August 23, 2011
USDCHF Daily with Elongated s?

"Elongated S" ref here :
From Winkinatcha Main Blog


Counter trend Scalp trading, It aint Rocket science...

Monday, August 22, 2011


Sunday, August 21, 2011

Monday, August 15, 2011
DJIA range pretty much complete on close
Coming up to close on the IGMarkets DJIA equivalent, and price has pretty much completed the Hourly range suggested by price action 5 days ago.
 I see the current area as a relatively low risk technical short... based on the scenario that price has commmpeted a 3wave structure or ABC, oft retraced past the point at the start of the wave structure...
that's the negative scenario for price, positive scenario is if we make significan upside from this area in the next day or 3 then more likely in a 5 wave up, which means a deeper retrace later but higher prices post the break out.
/AT THIS STAGE the closing action at least suggests initial shorts AFTER OPEN on the spi.
;)
Friday, August 12, 2011

Thursday, August 11, 2011
Dow Hrly Next 12hrs conjecture
Personally I think we are still in an uptrend.
Looking for a retrace of around 50% of last US session up, with bbuy potential around that 50% area.
Break down past 61.8% and consider short to y'day lows.
The following chart is that of IGMarkets DowJones equivalent... Price movements are similar to the SPX500, DJIA and e minis.. though actual values will differ.
 With a "weak" asian session, SPI (ASX200 (Australian market) ) falling on a Friday, if the close keeps this Fall intact (IE not a massive upspike on close) then odds are in favour based on historical observations, that the overnight market (US day session) will lift the SPI to an opening higher than the Friday close.
Still early afternoon here in Australia , an hour and a half to go before close and the SPI is dropping still.
Looking for a retrace of around 50% of last US session up, with bbuy potential around that 50% area.
Break down past 61.8% and consider short to y'day lows.
The following chart is that of IGMarkets DowJones equivalent... Price movements are similar to the SPX500, DJIA and e minis.. though actual values will differ.

Still early afternoon here in Australia , an hour and a half to go before close and the SPI is dropping still.
DOW update
Confession... I have no idea... this is just intellectual conjecture while I wait for the market to give me something to grab...


Esoteric wink stuff caution

The rise just now on dow came up from a "not quite" macd buy signal.
The MACD mavs have bracketed a bar (as highlighted by arrow) which suggests that price should get below the latest green candle.
If it does it will break the uptrend line black
And that is a fairly legit short signal.
Wednesday, August 10, 2011


Tuesday, August 9, 2011
A stochastic dome an elongated S and a 30 min trend

First up, note the price are marked on the chart with a red elipse and the corresponding pattern on the stochastics...
This is the combination of two phenomenons I have noted many times before... firstly, I refer to the price pattern as an elongated S and my observences are that these will retrace AT LEast 50%.
Secondly the ellipsed stochastic pattern i refer to as a "Stochastic dome... once the dome completes, invariably, the stochastics will move to the opposite extreme, or the same direction as the dome...
The final thing of interest i find here is the black marked Ellipses on the MACD . The bottom most and largest black ellips shows a great example of divergence on the MACD moving averages with higher lows being printed while price prints lower lows, Note how I have marked out what could well be the opposit signal occurring suggesting possible endo fo this trend soonish with higher highs printed on price and equal to lower highs printed on the MACD.
the 30 min time span is the highest (IE longest timespan) that recorded the divergence... Hrly and up do not show it. though 30, 15, 10 and 5 do.) This suggests to me that this Upsurge MAY WELL BE just a bounce in a greater down trend, and I would dearly like to see a lower low printing on price with divergence showing up on the hrly n above time charts to really see the low of Tuesday as a bottom.
Monday, August 8, 2011
The list is endless and FFs are to difficult
Just a quick note of thanks to the trading twitterers, Crew I have known from other places and new crew found here.
Something fundamental has changed. and it is obvious in my returns n attitude and confidence in trading.
It has nothing to do with finding a holy analysis grail, tho analysis will always be my passion.
And tho 'tis me who pulls the trigger n makes losses n profits, tis shoulders of giants upon which I stand, and company n support n acceptance of fellow traders that have boosted me.
If yer reading this then yer one of the many to whom I wish to extend my heartfelt thanks in helping me get here.
Big thx n Big Love
Thursday, August 4, 2011


Daily n weekly s/t SPI charts... nearing "buy" levels
 |
| Weekly |
 |
| Daily |
Wednesday, August 3, 2011


Two Pictures that say 1000 words (to me) EURUSD 15&60min
 |
| Working EURUSDHrly chart |
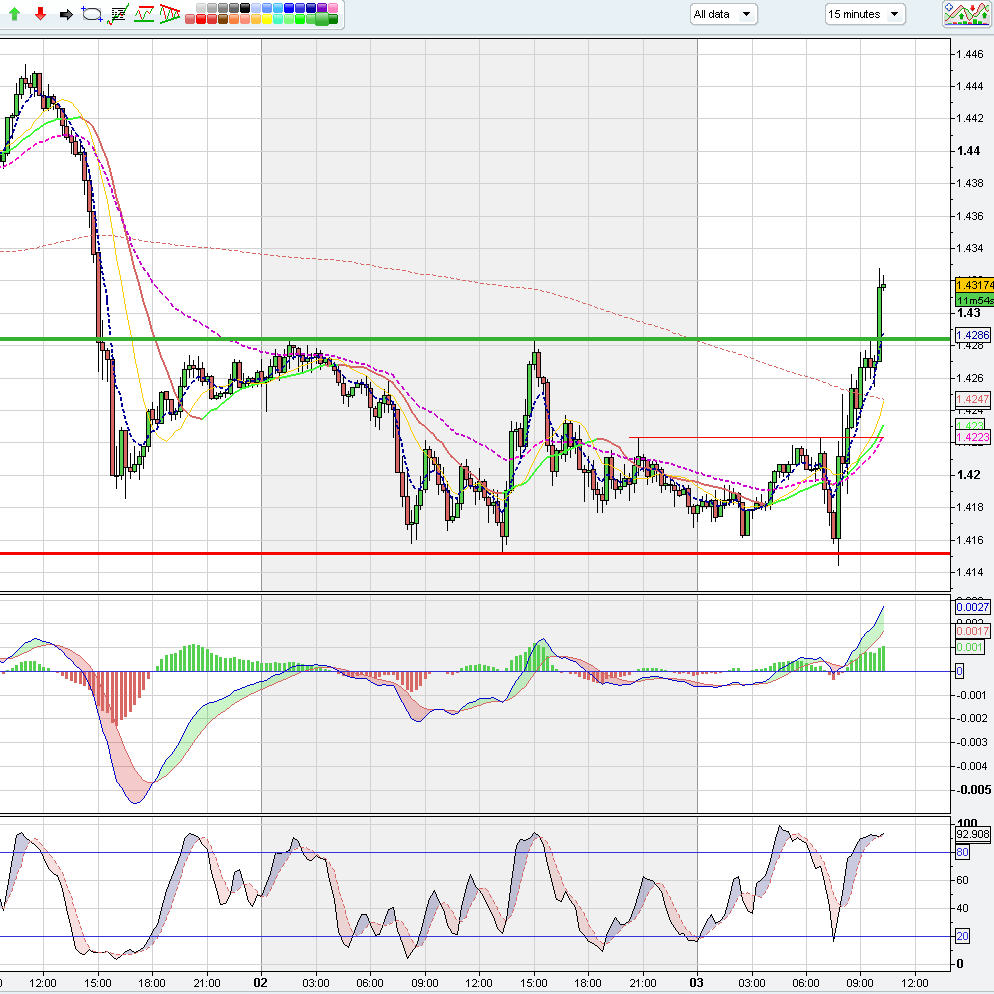 |
| Working EURUSD 15Min chart |
Subscribe to:
Comments (Atom)