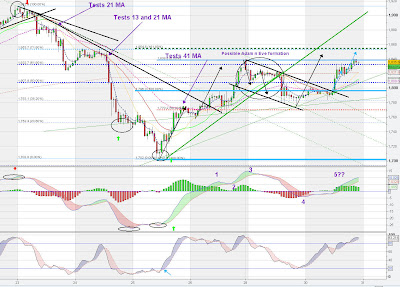
The following Hourly chart is my working chart, and so it is getting a little busy for easy public dissemination. reference back to my twitter blog for as it happened info.
The Adam n Eve formation played out pretty well, and in doing so, a conjectured 50% Retrace of an observed "elongated S" pretty much happened. the red dashed line is the 50% retrace level of that pattern, missed by 5 Gold dollars.
The Black lined channel stood out significantly and gave me the opportunity for a low risk short when price came back to hit the upside... Full advantage of that low risk was taken on that significant break through the top of the conjectured channel, and said short was exited with a small loss.
the old gray matter was not nimble enough to switch to longs so the rest of gold's (Aussie overnight) actionwas left alone. This morning I've had a closer look at the Momentum waves via the MACD as well as price and I See the following.
Currrently price is up at a localised (in the current hrly uptrend) double top level. Marked momentum waves COULD be hinting at a completion of 5 waves upwards (but need the MACD lines to cross over to confirm completion), supported by the stochastics on this time span being back in the Overbought region, again a crossover of THAT indicator required before too much excitement about downside can occur.
ASSUMING that the MACD waves are reflected in price, then a reasonable upside target is the dark green dotted line, a 1.618 extension of the Price level at the top of the momentum wave 1...
All in all though, I am disinclined to take a position either long or short with price at current level...Looking at an even lower timespan of 30 minutes...
Price patterns suggest a toin coss level at the moment, though note the INDICATORS arew suggesting reversal.
As said, not touching this instrument right now... I will let price decide what it wants to do and attempt to ride it when it makes up its mind.


No comments:
Post a Comment