Daily

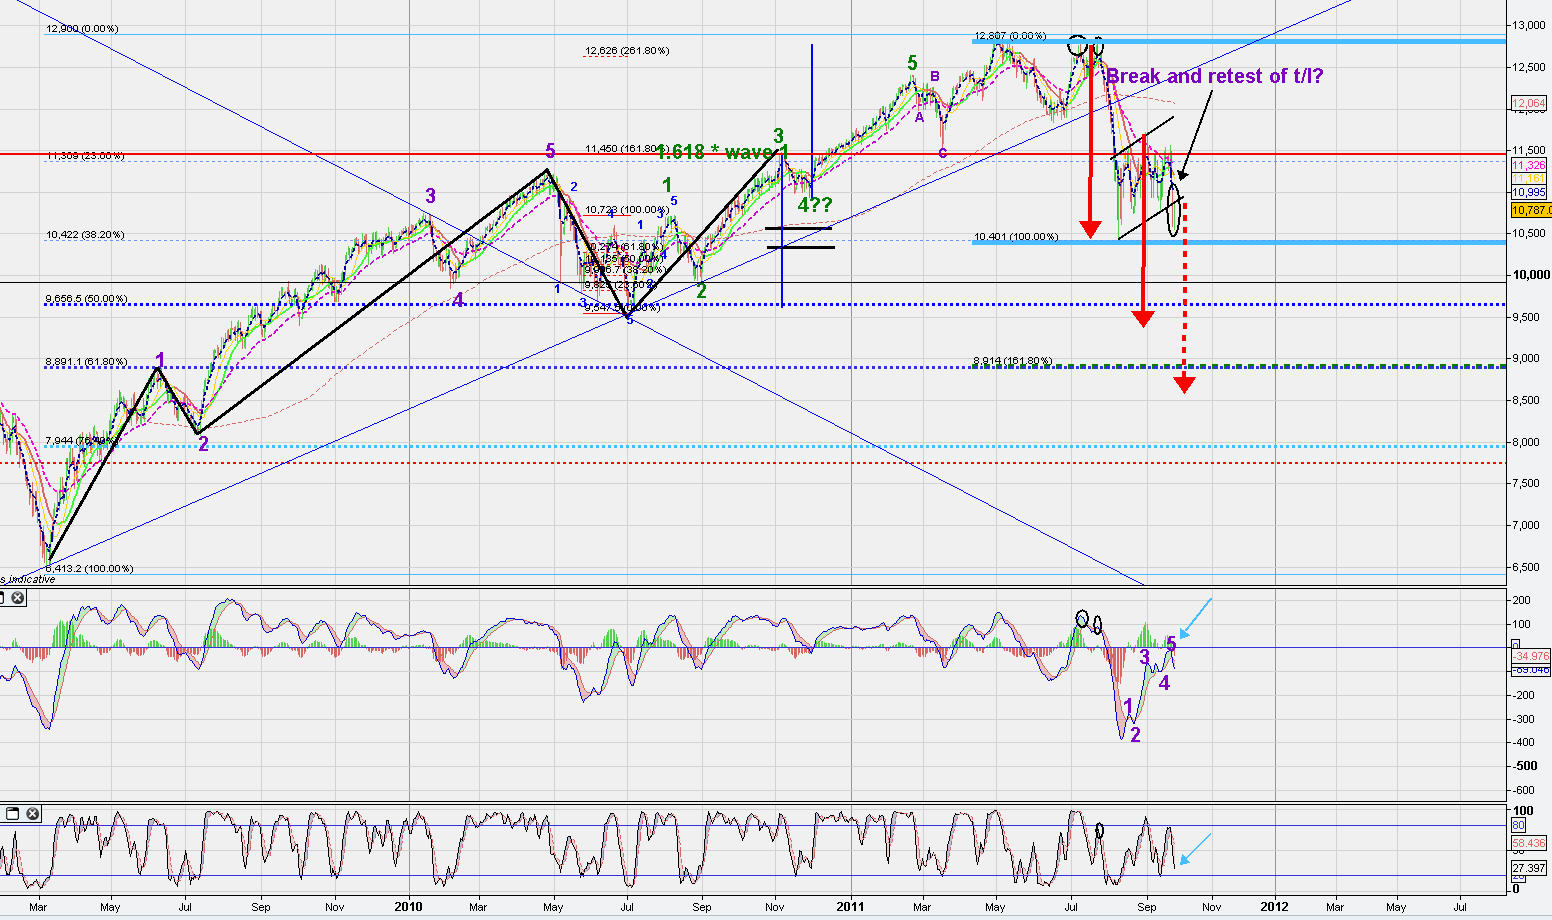
Not absolutely sure if the "Pole" for the pennant is supposed to be added to the "top" of the pennant or the "bottom" so dotted red arrow shows the "worst Case" scenariom, and filled Arrow shows the lesser worst case.
Note the level confluence between the dotted arrow and the Green dotted (lowest) 1.618 Fib extension of the first wave down.
As marked on the Pennant Break, price has broken and retested the bottom trendline in the last two days action... the Bearish perspective on that is ... downside is very available now.
also on the bearish side, the marked wave counts on the MACD, three discernible waves up and a Failure to break the zero line is a precominantly bearish sign.
Bigger picture view:
Simle bearish View n a few things to suggest it might be true...
;)
No comments:
Post a Comment